GC-MS Report Guide: How to Read the Peaks and Percentages
A GC-MS report looks like a verdict, but it is closer to a fingerprint. It lists the volatile compounds found in a sample and the share of the detector signal each one produced, and it says nothing on its own about whether an oil is pure or good. Read in the right order, though, it becomes one of the most useful documents a buyer can ask for.
Amyris Essential Oil
Our own Amyris Essential Oil, in sizes from 0.5 oz to bulk.
From $23.99
Shop Now →Start at the header
Before you look at a single peak, check that the report names the oil by its botanical name, carries a lot number that matches your bottle, says which laboratory ran it and when, and states the method: instrument, column and library. A report without a lot number is about some oil, not yours. Our worked example below comes from a published study of commercial oils, which spells all of this out (samples diluted to 1% in dichloromethane, a 60 m polar capillary column, mass spectra matched against two commercial libraries; Kucharska et al., 2021).
Print the report if you can. A pen and a highlighter turn a wall of numbers into a short checklist, and a missing lot number is much easier to spot on paper than on a phone screen.
Retention index, not retention time
The instrument separates the oil's components as they travel through a long column at different speeds, and each compound appears as a peak at its own retention time. That time shifts with the column, the temperature program and the machine, so labs convert it to a retention index by placing it between reference hydrocarbons. A tentative match on a non-polar column should land within about 10 units of the published value (Sadgrove et al., 2022). In practice that means a report should always name its column type, because an index from a polar column cannot be checked against a non-polar table.
Every name is a best guess
The mass spectrometer breaks each compound into fragments and software compares the pattern with a library. The result is a ranked list of candidates, not a confirmation. Alex St-Gelais of the Tisserand Institute points out that some sesquiterpenes and cyclic isomers give very similar spectra, which is why retention indices are needed as a second check (Tisserand Institute).
That matters for amyris. The oil is built mostly from sesquiterpene alcohols: valerianol, elemol and a family of eudesmol isomers. Those eudesmols are exactly the kind of near-twins where a library hit alone should not be trusted, and a line reading "eudesmol 26%" is usually several isomers added together.
What the percentages mean
Most reports give area percent, which is each peak's signal divided by the total signal. St-Gelais calls it a practical, widely accepted approximation, but an approximation. So a compound at 14.5% produced about 14.5% of the signal. It does not mean 14.5 grams in every 100 grams of oil.
The gap is real. In a study of adulterated lavender, diluting the oil with vegetable oil left the normalized percentages untouched, and only absolute quantitation revealed the shortfall (Capetti et al., 2021). A report based on normalized areas alone would have looked clean.
A worked example: three amyris-type oils
Kucharska and colleagues analysed six commercial oils sold as sandalwood, and three turned out to be amyris-type. Their numbers give us something to read. These are commercial samples of unknown origin, so they show a reading pattern, not a reference range for amyris.
Selected GC-MS results from Kucharska et al., 2021 (area %, as reported)
| Sample | Sold as | Valerianol | Eudesmol isomers | Elemol |
|---|---|---|---|---|
| P1 | Amyris | 14.53 | about 26 | 9.15 |
| P2 | Amyris | 14.38 | about 26 | 9.42 |
| P3 | Sandalwood | 8.04 | about 16 | 6.00 |
P1 and P2 are near-identical, valerianol-led and consistent with each other, which is what you hope to see. P3 carries the same compounds at lower levels, plus a notable share of caryophyllene, and no santalols at all, which is why the authors judged its sandalwood label wrong. The method for any report is the same: ask whether the marker compounds for the stated oil are present, whether they sit in a plausible proportion, and whether anything unexpected dominates. Because the same name can cover wide variation, never turn one paper's figures into a pass mark.
What GC-MS cannot see
- Natural versus synthetic. A compound looks the same either way. Chiral analysis, isotope ratios or carbon-14 testing are needed to separate them.
- Dilution with non-volatile carriers, as in the lavender example.
- Pesticides and heavy metals, which need their own tests.
- Organic status. No chromatogram can show it.
- Skilled adulteration. Sadgrove and colleagues note that adulterators have learned to get past these first-pass checks.
Where our Certificate of Analysis fits
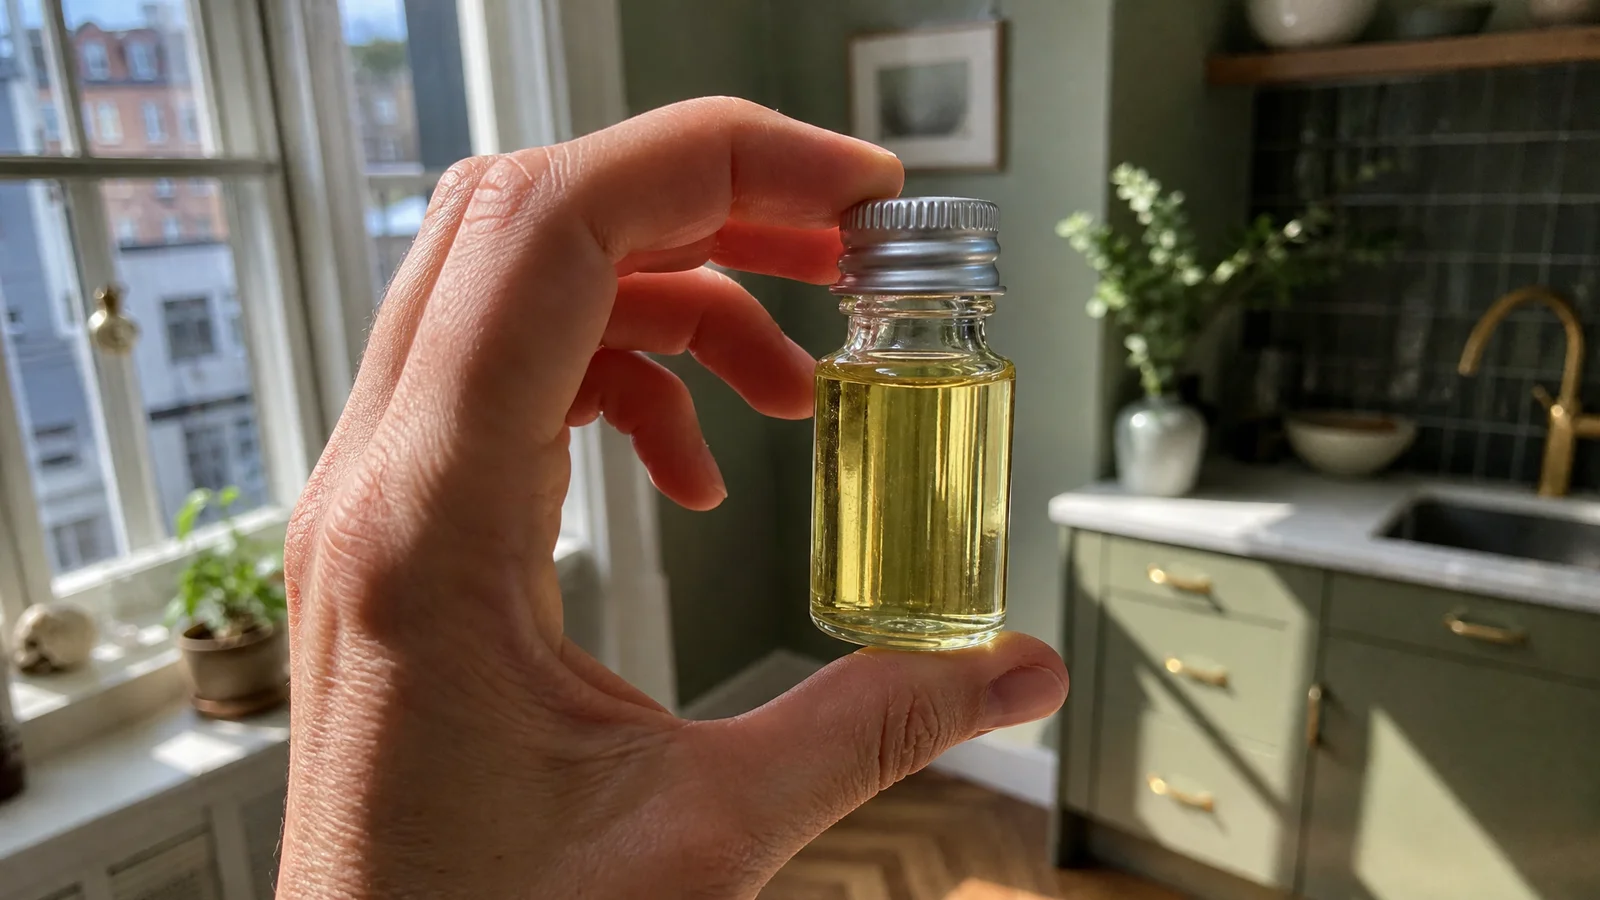
The Certificate of Analysis we publish is for one batch (AMYQGAABHTC003A) and lists physical constants: a yellow liquid, relative density at 20 C of 0.952 (standard 0.946 to 0.978), refractive index of 1.505 (standard 1.504 to 1.512) and optical rotation of +21.32 degrees (standard +20.00 to +45.00). You can read the full published COA.
Those are quick whole-liquid measurements, a plausibility screen rather than a composition test. A large admixture of something with a very different density or refractive index would push the numbers out of their windows, but the windows are fairly wide, so they cannot establish identity on their own. If you need GC-MS for amyris, ask us in writing through the contact page before you order, and when you have a report, run the steps above on it.
How to ask any supplier for a report
Send the lot number from your bottle and ask for the analysis for that lot. Ask which lab ran it, the date, the instrument and column, whether identification used retention indices, and whether the percentages are normalized areas or calibrated. Raise pesticides and heavy metals separately if they matter to you. Hana Tisserand lists a seller who cannot supply the lot-specific document among her red flags (Tisserand Institute).
For the wider picture, our guides on choosing essential oils, adulteration and what amyris oil is are a good next stop. A report is only as useful as the question you bring to it, so decide what you most want to rule out before you open one.
Amyris Essential Oil
Amyris Essential Oil from our own shop, in sizes from 0.5 oz to bulk.
From $23.99
Shop Now →Sources & Further Reading
- Kucharska M. et al., 2021. A Comparison of the Composition of Selected Commercial Sandalwood Oils with the International Standard. Molecules 26(8):2249. pmc.ncbi.nlm.nih.gov
- Sadgrove N.J. et al., 2022. Fundamental Chemistry of Essential Oils and Volatile Organic Compounds, Methods of Analysis and Authentication. Plants 11(6):789. pmc.ncbi.nlm.nih.gov
- St-Gelais A., Tisserand Institute. The Highs and Lows of GC-MS in Essential Oil Analysis. tisserandinstitute.org
- Capetti F. et al., 2021. Adulteration of Essential Oils: A Multitask Issue for Quality Control. Molecules 26(18):5610. pmc.ncbi.nlm.nih.gov
- Hana Tisserand, Tisserand Institute. Eight green and red flags when looking for your ideal essential oil supplier. tisserandinstitute.org